DataDNA challenge
DataDNA dataset challenge is an online monthly initiative within which one should visualize proposed data set. I've took part twice to practice a bit and take a closer look to data analytic community.
Nutrition Facts for Starbucks Menu
Worked with d3.js and its force-layout tool. I was curious also to construct multicategorical glyphs for Starbucks beverages, though even they are looking not very informative.
Live project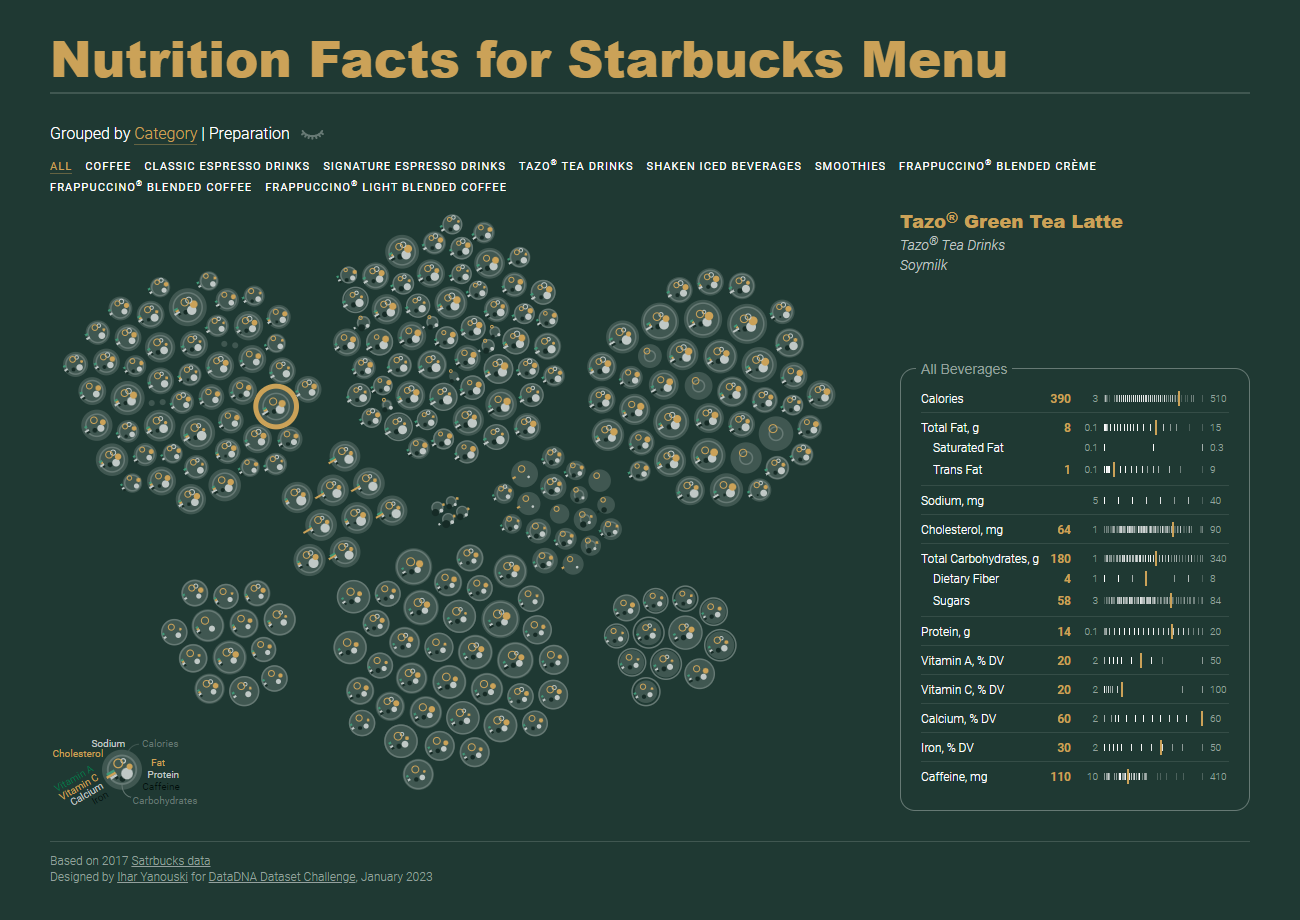
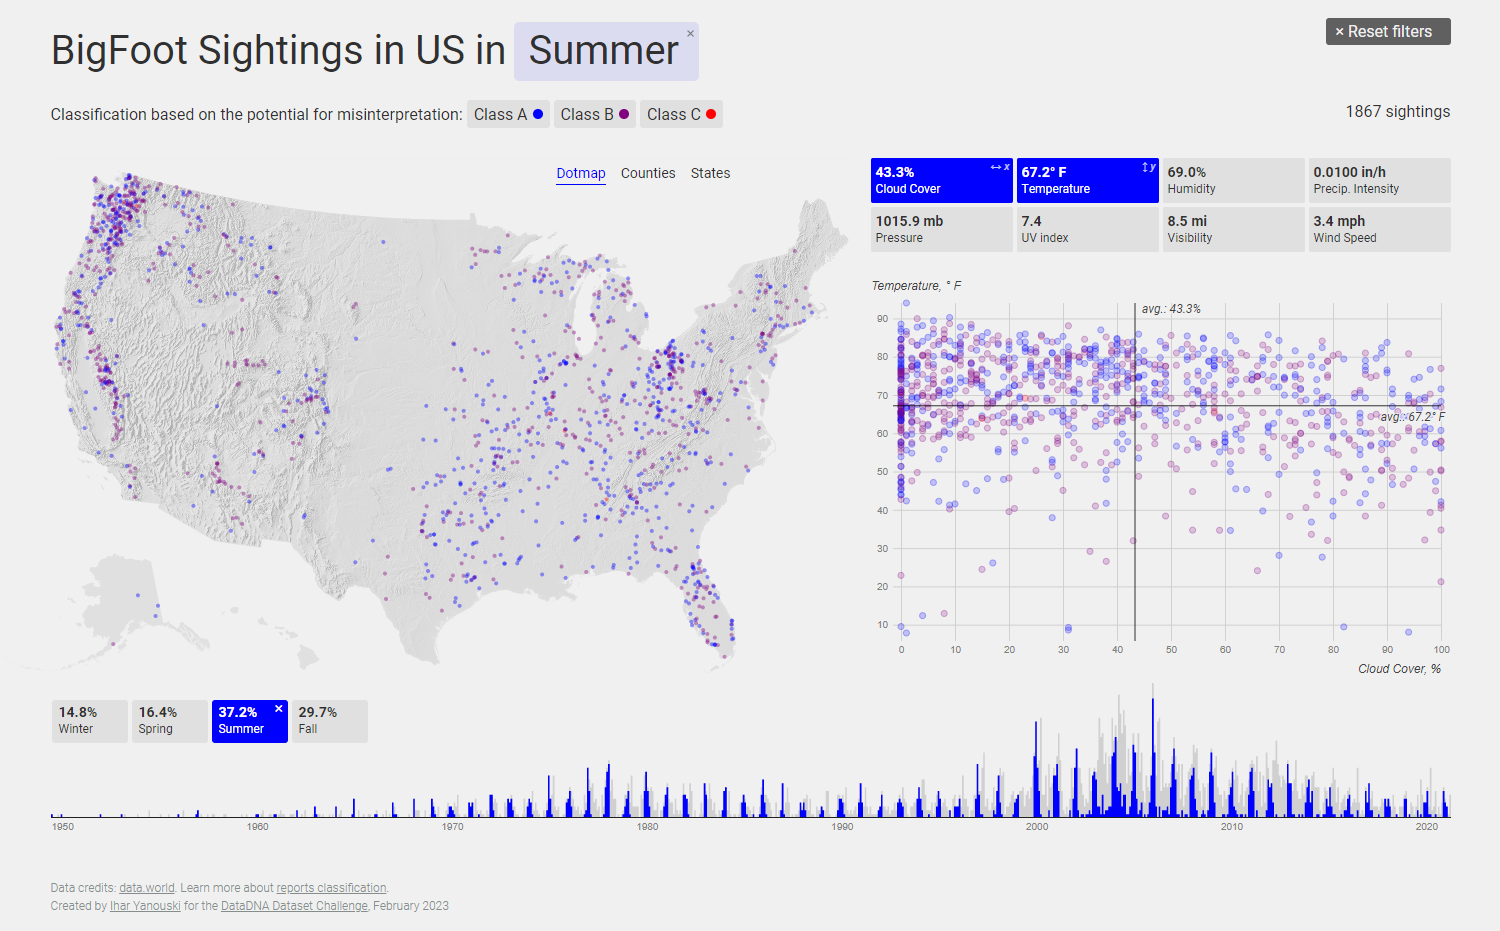
BigFoot Sightings in US
With this challenge I set the goal to practice geospatial data visualization. In particular, I was interested to get an idea of hillshading map process (I wasn't very lucky with it however). Anyway, I had fun creating web based dashboard with d3.js and sharpening my coding skills.
This work was recognized by the challenge jury in the "Creative Head" nomination.
Live project